Errors that start with 5 have one thing in common: the problem is not your browser or your connection, it is on the server side. Reloading the page ten times will not fix it. What does help is reading the number, because each one points to a different place to look.
First: where to see what happened
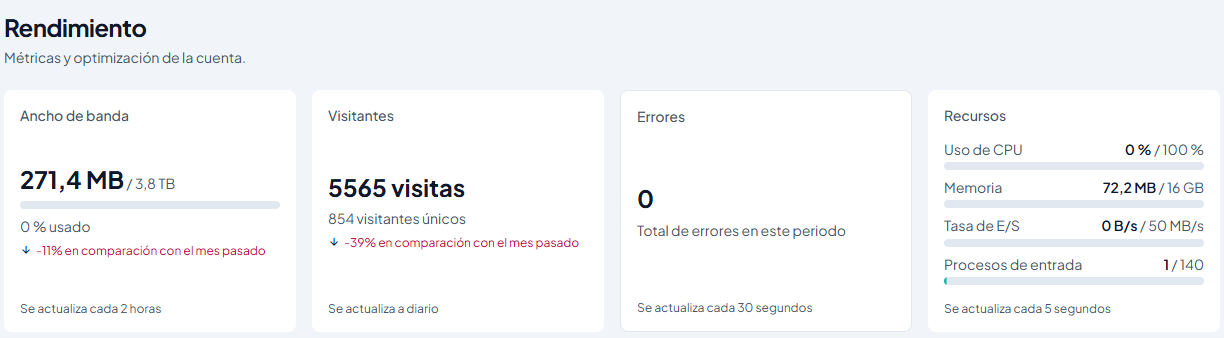
- cPanel → Performance (“Rendimiento”): the Errors card and the Recent errors tab show the latest web server errors for your account, with the time; the Resources card tells you whether your account is at its CPU, memory or process limit.
- The
error_logfile in your site's folder, under Files → File Manager. - In the classic design: Metrics → Errors and CPU and concurrent connection usage, which also keeps the history of how many times each limit was hit. Screenshots show the panel in Spanish.
If you just installed a plugin, changed the PHP version or uploaded new code, start by undoing that change.
500 Internal Server Error: the code failed
The server ran your site and something broke inside: a programming error, an incompatible plugin, a PHP version the site does not support, or a bad rule in .htaccess. The error log almost always names the file and the line.
502 Bad Gateway: something answered badly
The web server handed the request to the process that runs your code (PHP, Node.js or Python) and got back nothing usable: an empty or cut-off answer, or none. Usually a process crashed halfway, often from a fatal error or running out of memory, or a Node.js or Python app did not start.
503 Service Unavailable: cannot serve you right now
- Maintenance. WordPress shows a 503 while updating. If an update is interrupted it can get stuck; deleting the
.maintenancefile in the site's folder brings it back. - Memory or processes exhausted. When your site uses all the memory or processes of its plan, new requests get a 503 (or a 500).
- An app that will not start. For Node.js or Python apps published from cPanel, a 503 usually means an error in the startup file. See Node.js and Python.
504 Gateway Timeout: it took too long
The application did not fail; it did not answer in time. Typical causes: a very slow database query, a plugin calling an external service that does not respond (payment gateway, shipping API), or an import or backup running inside a page visit. If the error always appears on the same page or action, that is the culprit. Raising the maximum execution time eases the symptom; fixing the slow query cures it.
508 Resource Limit Reached: too many visits at once
This is not a standard web error: it comes from CloudLinux, the system that gives each account its own resources. It appears when your site reaches its number of entry processes (EP): how many visits can run PHP at the same time.
A visit that takes half a second frees its slot right away; one that takes ten seconds holds it twenty times longer. That is why a 508 is rarely fixed just with more capacity:
- Turn on page caching (in WordPress, LiteSpeed Cache). A page served from cache does not use a PHP process.
- Look for odd traffic: bots crawling your internal search or attacks on
wp-login.phptake the same slots as your customers. - Check when it happens in resource usage: how many times you hit each limit and at what time.
If the site still hits the limit at normal hours after that, then it does need a bigger plan: see How do I change my plan?
Summary
| Code | What it tells you | Where to look first |
|---|---|---|
| 500 | The site's code failed | Error log, latest change |
| 502 | The app answered badly or crashed | Error log, memory |
| 503 | No capacity to serve you right now | .maintenance, memory and processes |
| 504 | The app took too long | The slow page or action |
| 508 | Too many visits running PHP at once | Cache, bots, resource usage |
If the error does not go away, write to us from the portal with the exact time, the failing address and the code you saw. With those three details we find the cause in the log within minutes.
More information
- Article (Spanish): Errores 502, 503, 504 y 508: qué significan y qué revisar